

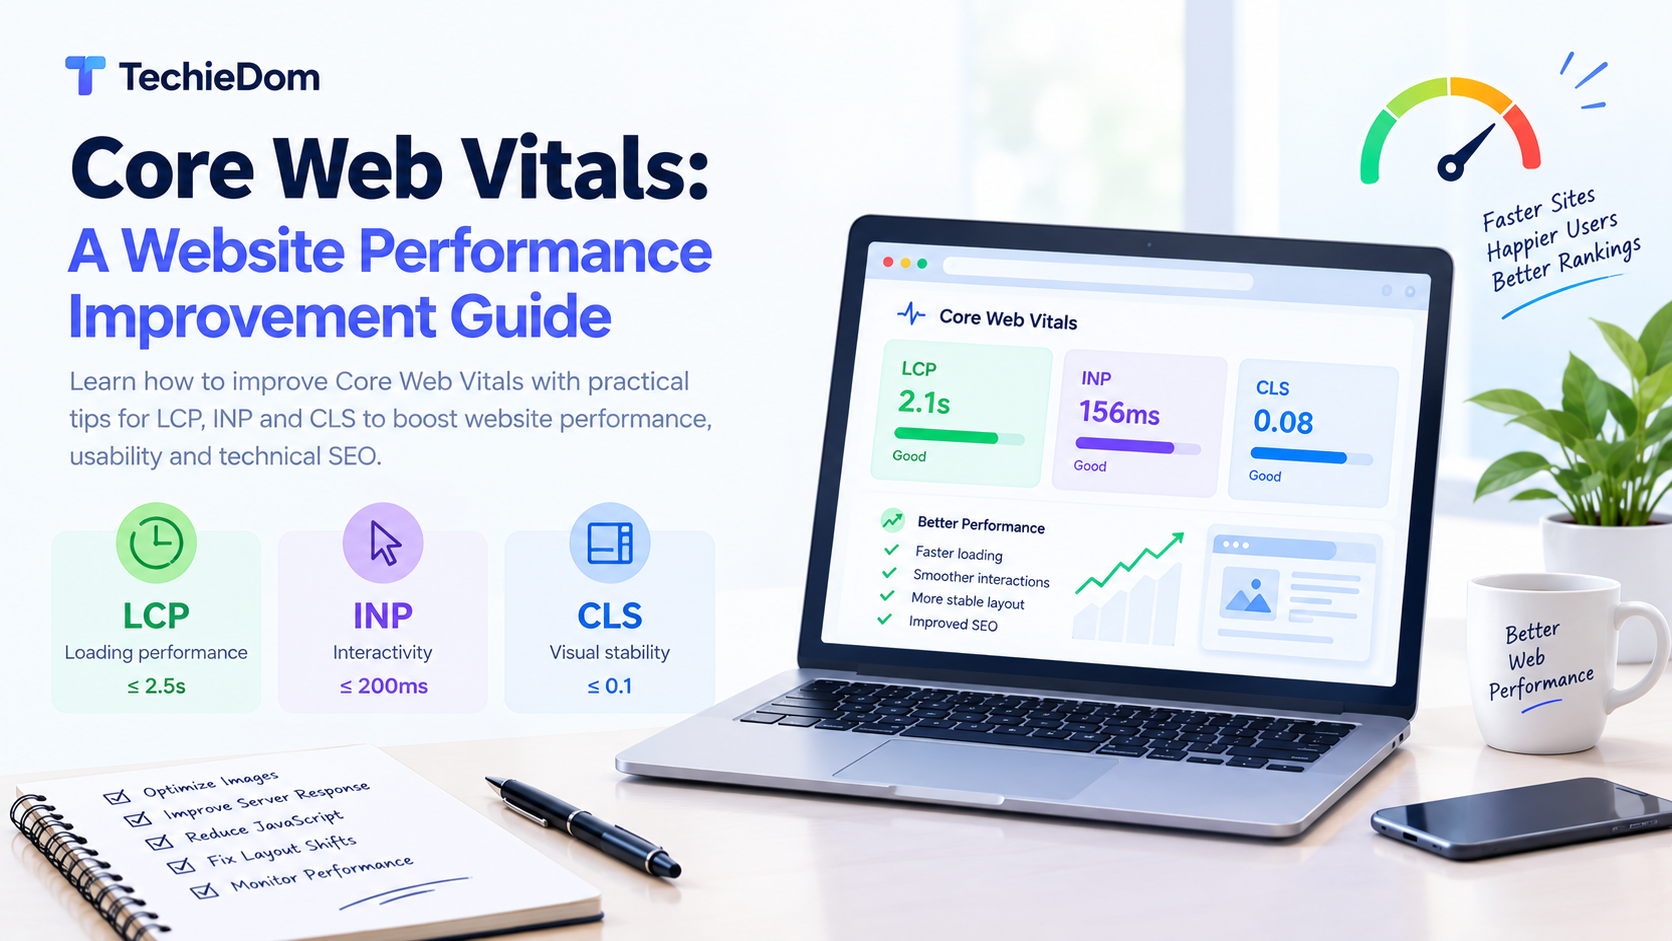
A fast, responsive, and visually stable website creates a better experience for visitors and helps businesses build trust online. When a page loads slowly, buttons take too long to respond, or content shifts unexpectedly, users may leave before completing an important action.
This is where Core Web Vitals become important. These Google performance metrics help website owners understand how visitors experience page loading, interactivity, and visual stability.
Improving Core Web Vitals is an important part of website performance optimization and technical SEO. Whether you manage a business website, an e-commerce store, or a web application, understanding these metrics can help you identify performance problems and prioritize improvements.
In this guide, we explain what Core Web Vitals are, how to measure them, and which practical techniques can help improve your website’s performance.
Core Web Vitals are a set of metrics that Google uses to evaluate important aspects of a webpage’s user experience. They focus on three areas: loading performance, interactivity, and visual stability.
The current Core Web Vitals metrics are:
Each metric has a recommended threshold that helps website owners assess whether their pages deliver a good experience.
| Metric | What It Measures | Good Performance |
|---|---|---|
| Largest Contentful Paint (LCP) | Loading performance | 2.5 seconds or less |
| Interaction to Next Paint (INP) | Responsiveness | 200 milliseconds or less |
| Cumulative Layout Shift (CLS) | Visual stability | 0.1 or less |
These thresholds are assessed at the 75th percentile of page visits, with mobile and desktop experiences evaluated separately.
A page does not need to load every element instantly to provide a good experience. The goal is to display the main content quickly, respond smoothly to user actions, and prevent unexpected changes to the layout.
Core Web Vitals are part of Google’s page experience considerations and can contribute to the overall quality of a website’s search experience. However, they are not a guarantee of higher rankings, and strong performance scores alone cannot compensate for irrelevant or low-quality content.
Here is why businesses should pay attention to them.
Visitors expect websites to load quickly and respond smoothly. Optimizing performance reduces frustrating delays and makes it easier for users to find information.
On service websites, e-commerce stores, and lead-generation landing pages, delays can interrupt important actions such as submitting a form, browsing products, or completing checkout.
A more responsive website can remove technical friction from these journeys, although actual conversion improvements depend on several factors.
Many visitors access websites through mobile devices and variable network connections. Performance optimization helps make essential content and interactions more accessible to these users.
Core Web Vitals audits can reveal oversized images, inefficient JavaScript, slow server responses, and other technical issues that may affect the user experience.
Performance improvements can make a website feel more reliable and easier to use. Combined with useful content, accessible design, and clear navigation, they contribute to a stronger overall digital experience.
To improve Core Web Vitals, you first need to understand what each metric measures and which problems can affect it.
Largest Contentful Paint measures the time it takes for the largest visible image, text block, or other qualifying content element within the viewport to render.
This element often represents the main content users want to see, such as a hero image, a prominent heading, or a large content block.
LCP targets:
Optimize important images: Compress large images and use modern formats such as WebP or AVIF where appropriate. Serve appropriately sized images for different screen sizes.
Improve server response time: Review hosting performance, backend processing, caching, and database queries. A faster initial HTML response can help the browser start rendering sooner.
Prioritize the main content: Avoid lazy-loading the main above-the-fold image if it is the LCP element. Consider appropriate preload hints or fetch priority for a critical hero image when testing confirms they are beneficial.
Reduce render-blocking resources: Remove unused CSS, minimize critical CSS, and defer non-essential JavaScript where appropriate.
Use a content delivery network (CDN): A CDN can help deliver static resources efficiently to visitors in different geographic locations.
For example, a business homepage with a large banner image may have poor LCP because the image is oversized and loads late. Optimizing its dimensions, format, and loading priority can reduce the time users wait to see the main content.
Interaction to Next Paint measures how responsive a webpage feels when a user clicks, taps, or uses the keyboard to interact with it. It considers interaction delays, processing time, and the time needed to present the next visual update.
INP targets:
Break up long JavaScript tasks: Divide lengthy tasks into smaller pieces so the browser has opportunities to process user interactions.
Reduce unnecessary JavaScript: Remove unused code, reduce excessive dependencies, and load non-essential functionality only when required.
Optimize event handlers: Keep click, tap, and keyboard event handlers efficient. Avoid performing expensive calculations directly during an interaction when work can be safely deferred.
Limit third-party scripts: Review analytics tools, chat widgets, advertising scripts, and other external integrations. Remove or defer scripts that do not provide sufficient value.
Reduce unnecessary rendering: In interactive applications, avoid updating large sections of the page when only a small component needs to change.
For example, if a product filter takes a noticeable amount of time to respond, developers can inspect the associated JavaScript, reduce unnecessary computations, and optimize how results are rendered.
These changes can make the website feel more responsive, especially on lower-powered mobile devices.
Cumulative Layout Shift measures unexpected visual movement during a page’s lifetime. It helps identify situations where content moves after users have started reading or interacting with the page.
CLS targets:
CLS is a score, not a time measurement.
Set image dimensions: Include width and height attributes or use an appropriate CSS aspect ratio so the browser can reserve space before images load.
Reserve space for advertisements and embeds: Allocate a predictable area for ads, videos, maps, and other third-party content.
Avoid inserting content above existing content: If a notification or promotional banner appears, avoid pushing the page content down unexpectedly. Use suitable overlays or reserved space when appropriate.
Optimize font loading: Use appropriate font-display settings and consider font metrics or fallback-font adjustments to reduce layout changes when web fonts load.
Keep dynamic components stable: Ensure that interactive elements, forms, and page sections do not cause unexpected movement during normal use.
For example, if a cookie banner or announcement bar suddenly pushes the page content downward, visitors may lose their reading position or click the wrong element. Planning the layout around these components can help reduce unexpected shifts.
Before implementing changes, establish a performance baseline. Use a combination of field data and laboratory testing to identify which pages need attention.
Google PageSpeed Insights provides field data when available and laboratory performance diagnostics.
It helps identify:
Use the results to identify the most significant issues rather than attempting to fix every diagnostic warning at once.
The Core Web Vitals report in Google Search Console groups eligible URLs by their reported performance status and metric issues.
It can help you understand whether problems affect groups of pages rather than just one URL. For example, multiple service pages may share the same template and suffer from the same image-loading or layout problem.
Search Console data is based on real-world user experiences and may take time to reflect changes.
Chrome DevTools and Lighthouse are useful for investigating performance problems in a controlled test environment.
They can help identify:
Laboratory results help with debugging, but they do not replace field data from real visitors.
Real User Monitoring collects performance data from actual website visits. Depending on the implementation, it can help teams understand how performance varies by device, page template, browser, or network conditions.
RUM is particularly useful for large websites and web applications where performance may differ significantly across user journeys.
A structured workflow makes performance improvements easier to prioritize, implement, and measure.
Start with high-value URLs, such as the homepage, service pages, landing pages, product pages, and checkout pages.
Review PageSpeed Insights and Search Console to identify the affected metrics and page groups.
Do not rely on the score alone. Investigate why the metric is poor.
For example:
Focus on changes that address the underlying problem and affect important user journeys.
Examples include optimizing a shared page template, reducing a large JavaScript bundle, or fixing layout shifts across multiple pages.
Work with developers to implement improvements in a staging environment when practical. Test responsive layouts, functionality, accessibility, and the visual experience to ensure optimizations do not introduce new problems.
Run the same tests after implementation and compare the results with the original baseline.
Use both laboratory testing and field data where available. Remember that laboratory measurements can change between runs, and field metrics take time to accumulate.
Core Web Vitals should be part of ongoing website maintenance. New images, scripts, plugins, design changes, and content updates can introduce performance regressions.
Include performance checks in the development workflow so issues can be detected before they affect a large number of users.
Use this checklist as a starting point for a website performance audit.
Improving performance requires more than chasing a perfect Lighthouse score. Avoid these common mistakes when planning optimization work.
Focusing only on desktop: A website may perform well on a powerful desktop but struggle on mobile devices. Review both experiences.
Treating a lab score as the complete picture: Laboratory testing is valuable for debugging, but field data reveals how real visitors experience the website.
Lazy-loading every image: Lazy loading can help with below-the-fold images, but delaying a critical hero image can worsen LCP.
Removing scripts without reviewing their purpose: Some third-party tools support essential business functions. Review their performance cost and business value before removing them.
Optimizing without testing functionality: Changes to JavaScript, CSS, or image loading can break interactions or visual layouts. Verify that the website continues to work correctly.
Expecting immediate ranking improvements: Core Web Vitals are only one part of Google’s broader ranking systems. Performance improvements do not guarantee higher positions in search results.
Core Web Vitals should be addressed alongside other technical SEO requirements, including crawlability, indexability, mobile usability, internal linking, structured data, and content quality.
A fast website is not automatically search-engine friendly if important pages cannot be crawled or indexed. Similarly, excellent technical performance cannot replace useful content that matches the search intent of potential customers.
For business websites, the strongest approach combines technical SEO, relevant content, accessible design, and reliable development practices.
For example, optimizing a service landing page may involve improving its LCP, simplifying its navigation, ensuring that its primary content is accessible to search engines, and making the contact form easy to use on mobile devices.
This coordinated approach supports both the technical quality of the website and the experience it provides to visitors.
Website performance is an ongoing process that requires technical analysis, development expertise, and regular monitoring.
TechieDom helps businesses build and improve digital experiences through website design, development, and related technology services. Depending on your website’s needs, a performance improvement project may involve reviewing page templates, optimizing images and scripts, improving responsive behavior, and addressing technical issues that affect loading speed and responsiveness.
A structured approach helps teams identify the most important problems, implement practical fixes, and measure whether those changes improve the user experience.
If your website loads slowly, responds poorly to user interactions, or experiences unexpected layout shifts, consider starting with a performance audit and a prioritized improvement plan.
Explore TechieDom’s website development and related services to discuss your project requirements.
The three Core Web Vitals are Largest Contentful Paint (LCP), Interaction to Next Paint (INP), and Cumulative Layout Shift (CLS). They measure loading performance, responsiveness, and visual stability, respectively.
A page meets the good thresholds when LCP is 2.5 seconds or less, INP is 200 milliseconds or less, and CLS is 0.1 or less. Google evaluates these metrics at the 75th percentile of visits, with mobile and desktop assessed separately.
Core Web Vitals are part of Google’s page experience considerations and can contribute to ranking systems. However, they are not a standalone ranking guarantee. Relevance, content quality, and many other signals remain important.
Start by identifying the specific causes of poor performance. Image optimization, caching improvements, reducing unnecessary JavaScript, fixing layout shifts, and optimizing existing page templates can often improve performance without requiring a complete redesign.
Review performance after major design, development, plugin, or content changes. For business-critical websites, monitor field data regularly and include performance testing in the ongoing maintenance process.
Google PageSpeed Insights is a useful starting point because it can provide both field data and laboratory diagnostics when available. Google Search Console helps identify affected URL groups, while Chrome DevTools and Lighthouse support deeper debugging.
The timeline depends on the causes of poor performance, website complexity, hosting setup, and development resources. Some image or caching improvements may be straightforward, while JavaScript optimization or architectural changes may require more extensive work.